RCE Endeavors 😅

May 25, 2023

Function Hooking: Trampolines & Detours (2/7)

Filed under: Programming,Reverse Engineering — admin @ 11:42 PM

Table of Contents:

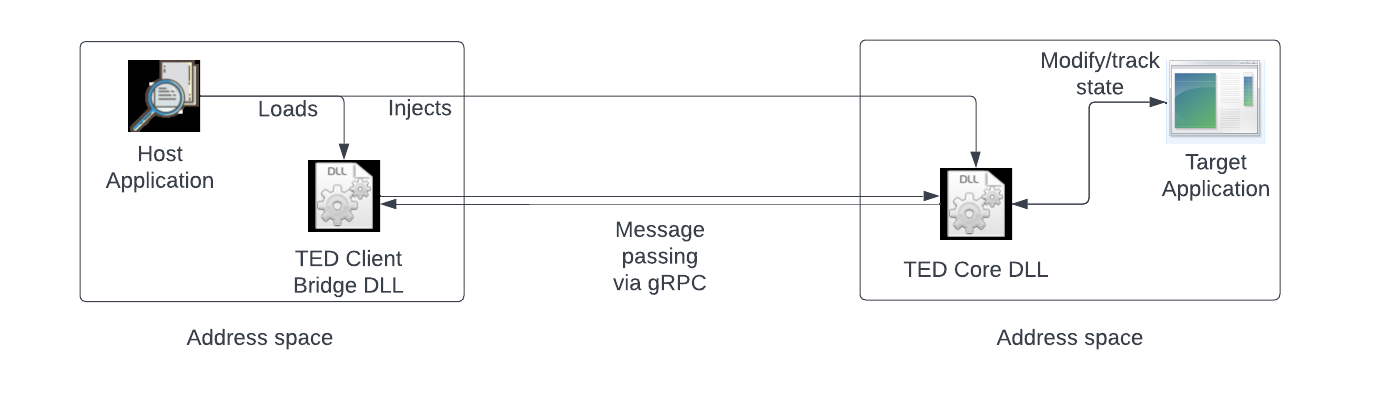
The previous post showed a valid technique for installing an inline hook. However, overwriting the original instruction bytes of the target function created a problem: these instructions were lost, leaving no way for the original function to be called. The way to remedy this problem is to create a new dynamically generated function — the trampoline function — that holds the original instructions in another part of the program’s executable memory. At the end of this function, there will be an unconditional jump back to the rest of the original function. Visually, the diagram below describes what will happen:

The control flow after an inline hook as been installed. The calling code will call DisplayMessageOnInterval, which will pass control flow to DisplayMessageOnIntervalHook. The hook will then call the trampoline function to pass control back to DisplayMessageOnInterval.

Creating the trampoline

To implement this will require allocating an executable block of memory, copying in the original instructions, and then adding the unconditional jump at the end. You can write a CreateTrampoline function to do this:

void* CreateTrampoline(void* const targetAddress, const size_t size) {

    const auto jumpBack{ CreateJumpBytes(
        reinterpret_cast<unsigned char*>(targetAddress) + size) };
    
    const auto trampolineStub{ VirtualAlloc(nullptr, size + jumpBack.size(),
        MEM_RESERVE | MEM_COMMIT, PAGE_EXECUTE_READWRITE) };
    if (trampolineStub == nullptr) {
        PrintErrorAndExit("VirtualAlloc");
    }

    std::memcpy(trampolineStub, targetAddress, size);
    std::memcpy(&reinterpret_cast<unsigned char *>(trampolineStub)[size],
        jumpBack.data(), jumpBack.size());

    return trampolineStub;
}

The CreateTrampoline function allocates executable memory for the relocated instructions, copies them in, then adds an unconditional jump back to the original code.

Here you allocate a block of executable memory by calling the VirtualAlloc function with the PAGE_EXECUTE_READWRITE flag. After successfully allocating the memory, it is simply a matter of copying in the instructions with memcpy and appending the unconditional jump at the end. The memory block will have instructions similar to the ones in the table below, though with different runtime and destination addresses.

Runtime AddressInstruction BytesInstruction
0x000002C4F37E000048 89 4C 24 08mov qword ptr [rsp+0x8], rcx
0x000002C4F37E000556push rsi
0x000002C4F37E000657push rdi
0x000002C4F37E000748 81 EC D8 00 00 00sub rsp, 0x0D8
0x000002C4F37E000E48 8D 7C 24 20lea rdi, [rsp+0x20]
0x000002C4F37E001348 B8 F3 11 67 09 F6 7F 00 00mov rax, 0x7FF6096711F3
0x000002C4F37E001DFF E0jmp rax
The instructions of the trampoline.

Installing the hook

Now all that is left is to define the trampoline signature and function pointer, modify the HookDisplayMessageOnInterval function to call the trampoline, and add functionality in the InstallInlineHook function to set the trampoline pointer. This is achieved with the code shown below:

// Trampoline pointer declaration
using HookDisplayMessageOnIntervalTrampolinePtr = void (__stdcall*)(
    const std::string& message);
static HookDisplayMessageOnIntervalTrampolinePtr HookDisplayMessageOnIntervalTrampoline{};

void HookDisplayMessageOnInterval(const std::string& message) {

    std::cout << "HookDisplayMessageOnInterval function called!"
        << std::endl;
    HookDisplayMessageOnIntervalTrampoline("Hooked Hello World");
}

template <typename Trampoline>
void InstallInlineHook(void* const targetAddress, const void* const hookAddress,
    const Trampoline*& trampolineAddress) {

    trampolineAddress = reinterpret_cast<Trampoline*>(
        CreateTrampoline(targetAddress, 19));

    // Rest of code is the same
}

Additional code showing declarations of the trampoline and the modified HookDisplayMessageOnInterval and InstallInlineHook functions.

Calculating overwrite size

You may notice that there is a magic number (19) that is being passed to the CreateTrampoline function. This is the size, in bytes, of the instructions that will be relocated to the trampoline. Since the mov and jmp overwrite size takes up 12 bytes, and entire instructions need to be relocated (just copying 12 bytes will result in a partial copy of an instruction), the size needs to be rounded up to capture the full instruction. This is better illustrated in the table below; count the instruction bytes for the five instructions that are relocated to the trampoline.

Instruction BytesInstruction
48 89 4C 24 08mov qword ptr [rsp+0x8], rcx
56push rsi
57push rdi
48 81 EC D8 00 00 00sub rsp, 0x210
48 8D 7C 24 20lea rdi, [rsp+0x20]
B9 2E 00 00 00mov ecx, 0x2Eh
B8 CC CC CC CCmov eax, 0xCCCCCCCC
The original prologue instructions of DisplayMessageOnInterval. The highlighted rows denote the instructions that are overwritten.

Verifying the hook

At this point, the new version of the inline hook is ready to test. After re-running the code with the new changes, the console output should display “Hooked Hello World” on a five second interval, demonstrating that the hook function was called, modified a parameter, and forwarded the rest of the call to the original DisplayMessageOnInterval function.

This works great for the example program, but unfortunately it is not applicable in every situation. While relocating the instructions that were compiled for this example worked perfectly fine, that is not guaranteed to be the case all of the time. Imagine if you had relocated an instruction that references any sort of relative location, i.e., an instruction that does RIP-relative addressing, or relative branch instructions. When you relocate those types of instructions to another part of memory, the addresses that they were referencing would not match up, likely leading to a crash at runtime at some point in the program’s execution.

The fix for this is not quite so simple; it boils down to needing a disassembler to identify whether the instruction performs any sort operation on a relative address. Fortunately, there is an inline hooking library that takes care of this and provides an easy-to-use API, which will be covered in the second half of this post.

Running the demo

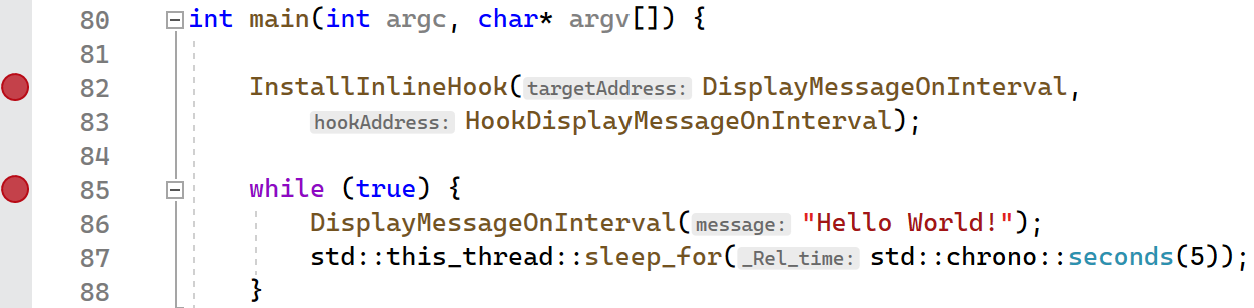
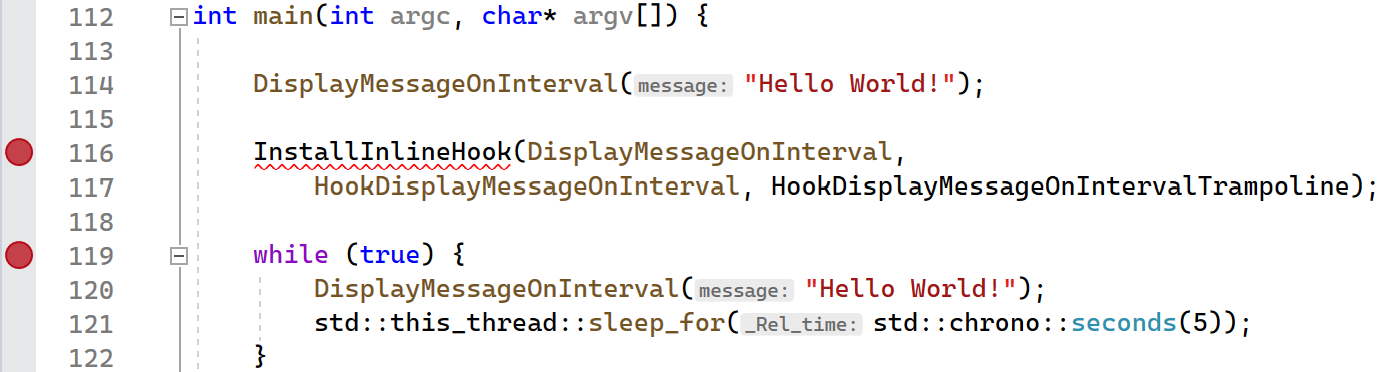
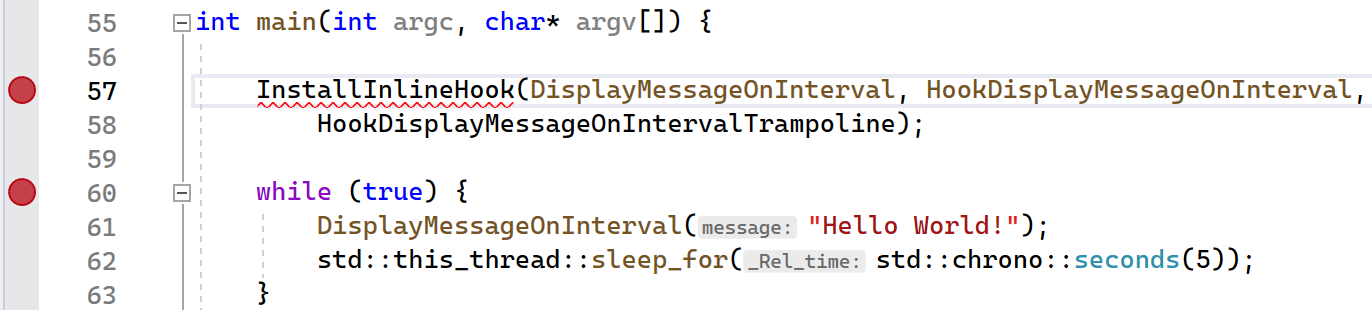
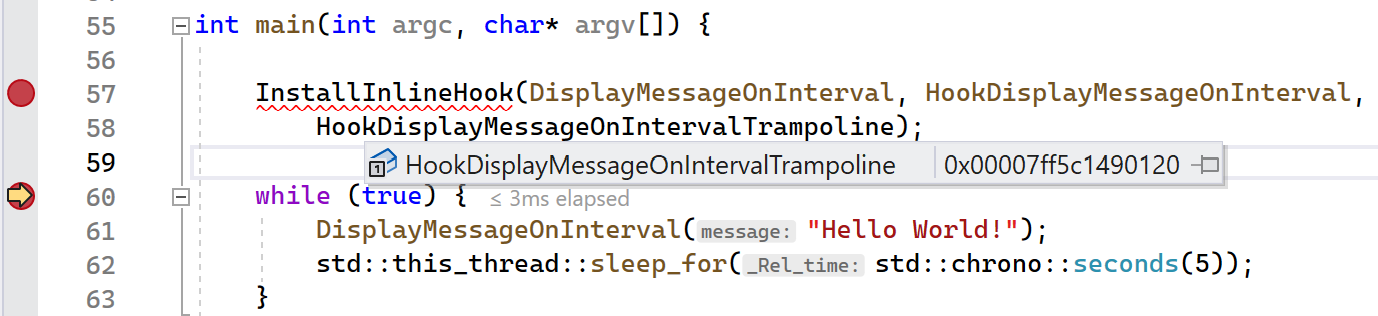
The InlineHookWithTrampoline project provides the full implementation that was presented in this section. As before, you can begin by setting breakpoints on the InstallInlineHook and the line immediately following, as is shown below:

Setting a breakpoint on InstallInlineHook and the next immediate line.

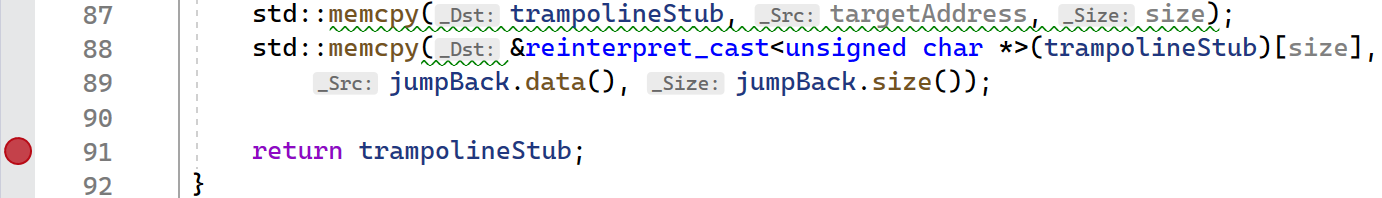
To inspect the generated trampoline, set another breakpoint on the return statement of the CreateTrampoline function.

A breakpoint being set on the return statement.

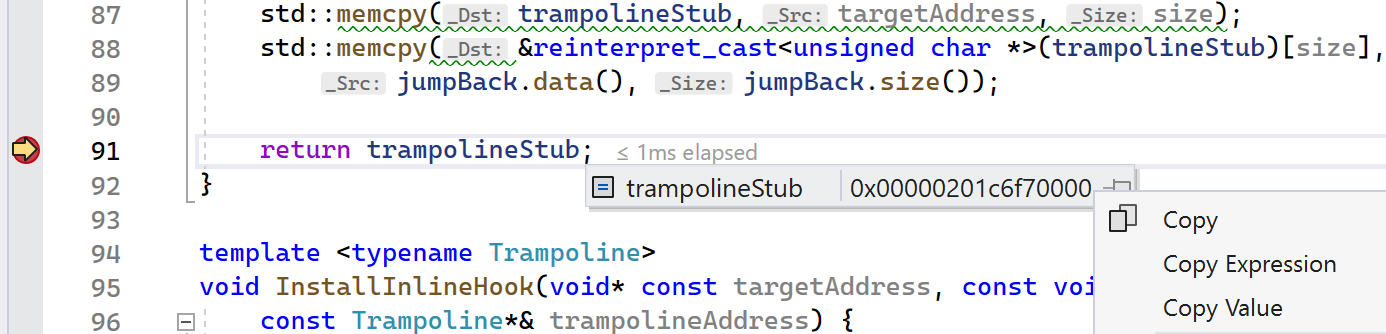
Launch the application in Visual Studio and verify that your first breakpoint on the InstallInlineHook function was hit immediately. Continue execution so that the next breakpoint gets hit. You should now be in a broken state on the return statement in the CreateTrampoline function. Hover your mouse over the trampolineStub variable. A context menu should pop up showing the variable name and address. Right click the address and select “Copy” from the menu.

The context menu of the trampolineStub variable.

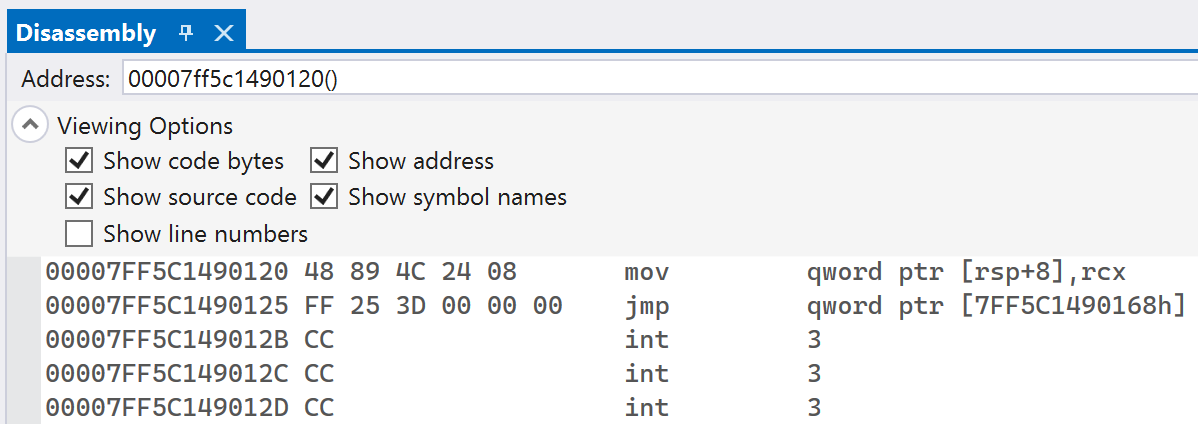
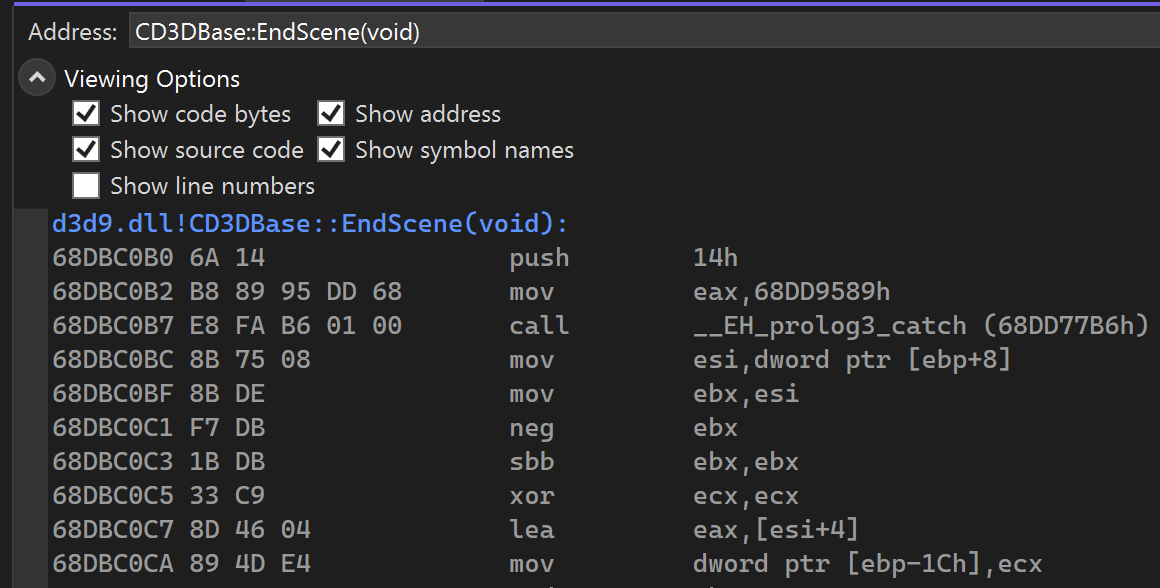
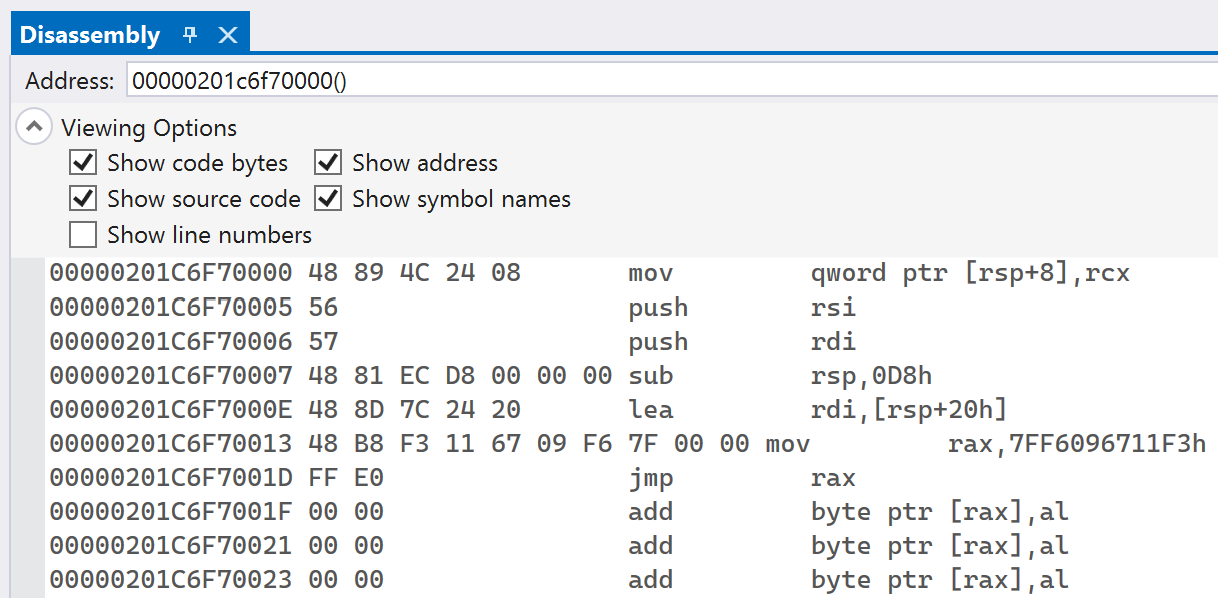
Navigate to the Disassembly window in Visual Studio and paste in the address of trampolineStub in the Address text box. You should see instructions similar to what is shown in below:

The trampoline stub instructions.

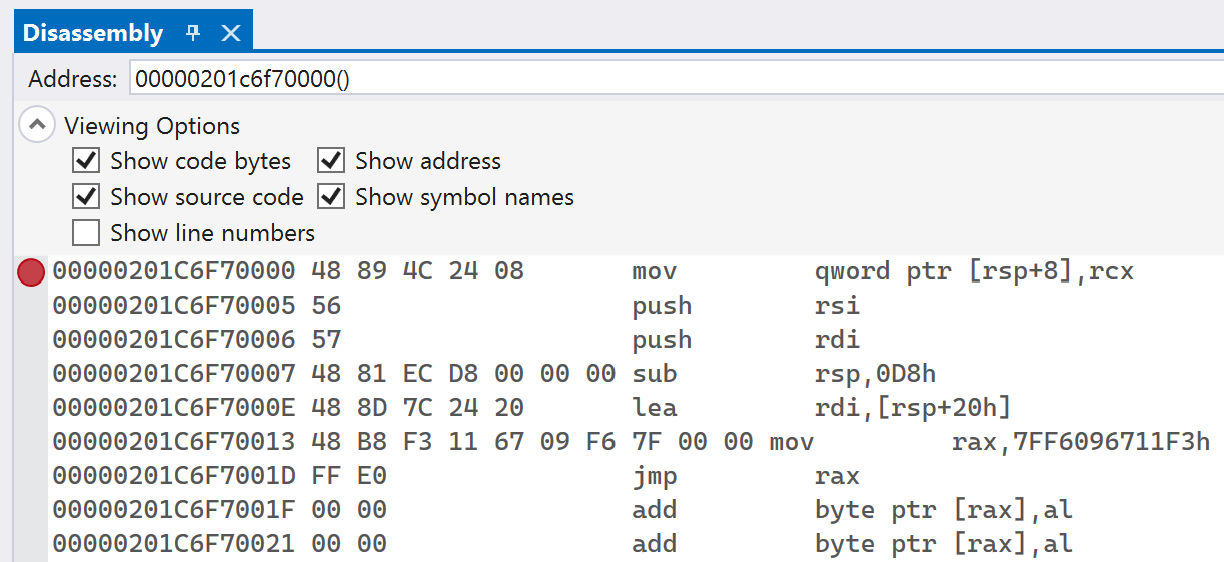
In the Disassembly window, you can set breakpoints on individual instructions. As in the code editor, click to the left of the address to enable a breakpoint on it. Once your breakpoint is enabled, you will see a red circle.

A breakpoint set on the first instruction of the trampoline stub.

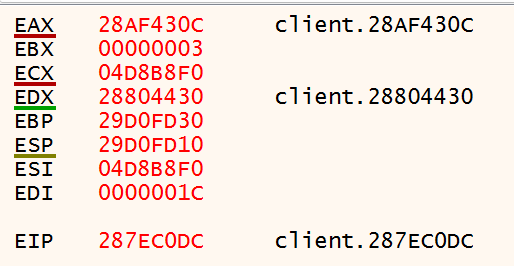
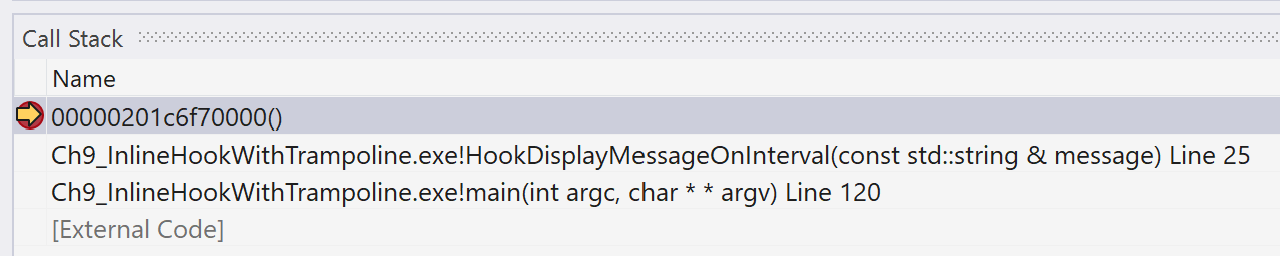
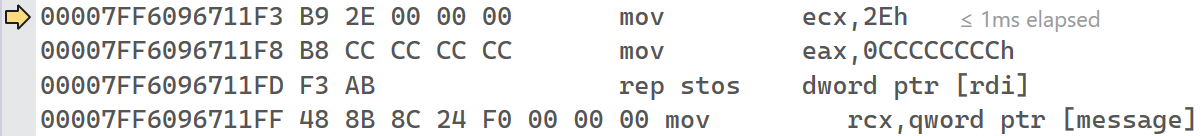
After setting this breakpoint, continue execution of the program. The breakpoint on the while loop should be hit, since it is the line of code that immediately follows the InstallInlineHook function. Continue execution once more. You should now be broken on the mov instruction in the trampoline stub. The call stack shows that the trampoline stub is being called from the HookDisplayMessageOnInterval function, as expected.

The call stack when the trampoline stub is executed.

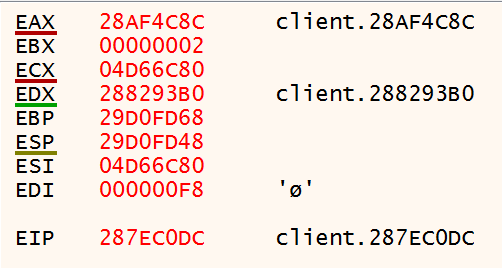
In the Disassembly window, with press the F11 key to let the Visual Studio debugger perform a Step Into operation. Continue doing this until you have executed past the final jmp rax instruction of the trampoline stub. Notice that you are back in the original HookDisplayMessage function, but at the address past the overwritten bytes.

Jumping back into the HookDisplayMessage function.

This has shown the entire flow of events, starting with the generation of the trampoline stub, then its invocation by the hook function, and finally how the trampoline stub passes control back to the original function.

Detours

Detours is a library released by Microsoft that, among other useful features, provides the ability to install inline hooks on arbitrary functions. The library itself is open source, available for multiple architectures, and well documented. Detours has some nice abstractions; the library hides the need to change memory page protections, performs the trampoline function allocation and copy, and is able to handle fixing up relative instructions that were relocated. Internally, Detours is able to disassemble instructions at the target address, so as a user you do not need to calculate how many instructions to relocate and overwrite.

Installing the hook

To install an inline hook using Detours, the InstallInlineHook function can be modified as is shown below:

template <typename Trampoline>
void InstallInlineHook(void* targetAddress, void* const hookAddress,
    const Trampoline*& trampolineAddress) {

    DetourTransactionBegin();

    DetourUpdateThread(GetCurrentThread());
    PDETOUR_TRAMPOLINE detourTrampolineAddress{};
    DetourAttachEx(&(static_cast<void*&>(targetAddress)),
        static_cast<void *>(hookAddress),
        &detourTrampolineAddress, nullptr, nullptr);
    trampolineAddress = reinterpret_cast<Trampoline*>(detourTrampolineAddress);
    // Add any additional hooks here

    DetourTransactionCommit();
}

The DisplayMessageOnInterval function showing how to install an inline hook with the Detours API.

Detours treats installing inline hooks as part of a transaction, meaning you can perform multiple hook install and removal operations in one action. DetourTransactionBegin is called to begin a new transaction to install or remove an inline hook — a detour to use the library’s terminology. DetourUpdateThread is used to enlist a thread to perform the instruction overwriting. DetourAttach[Ex] is used to specify where the detour should be installed; which target address should be detoured to a hook address. Lastly, DetourTransactionCommit is called to commit the transaction and perform the installation or removal of detours.

Running the demo

The InlineHookDetours project provides the full implementation that was presented in this post. When opening this project, a Windows x64 package of Detours will be installed via the provided vcpkg.json file. Once installed, the project can be built and the demo application can be run. Detours will work in a very similar manner to the previous section where inline hooks with trampolines were covered. The best way to see this is to add breakpoints on the InstallInlineHook function and the subsequent line, as shown below.

Setting breakpoints on the InstallInlineHook in the Detours demo project.

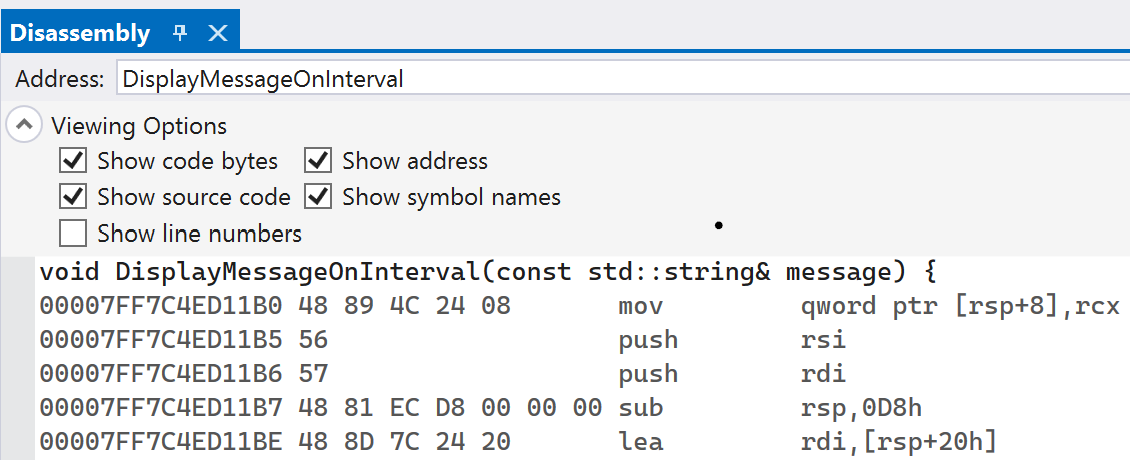
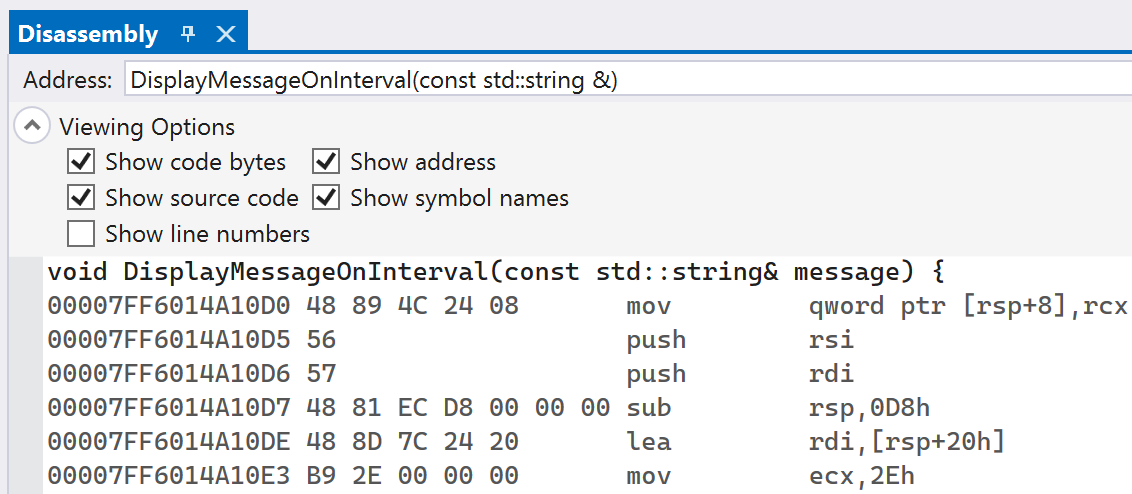
Launch the application and let it hit the first breakpoint on InstallInlineHook. Use the Disassembly window to inspect the instructions at the address of DisplayMessageOnInterval. The instructions should look similar to the image below.

The original instructions of DisplayMessageOnInterval.

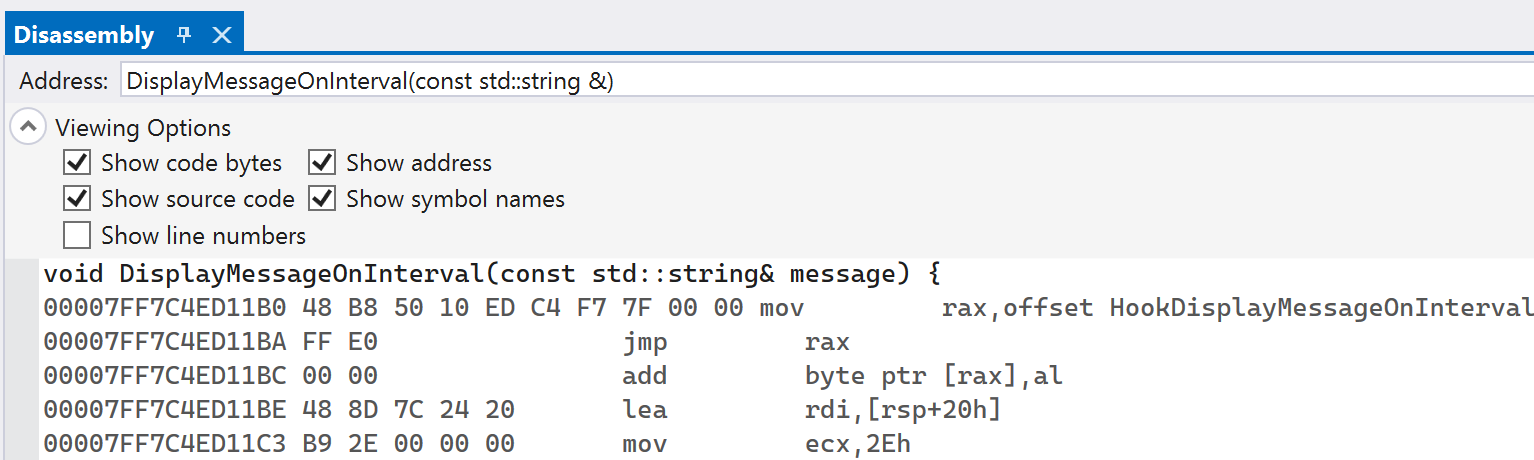
Continue execution to let the Detours library install the inline hook. After the second breakpoint following the InstallInlineHook function is hit, the hook will be installed. You can inspect the address of DisplayMessageOnInterval again and see that there has been an unconditional jump written in.

The instructions of DisplayMessageOnInterval after the Detours library has placed an inline hook.

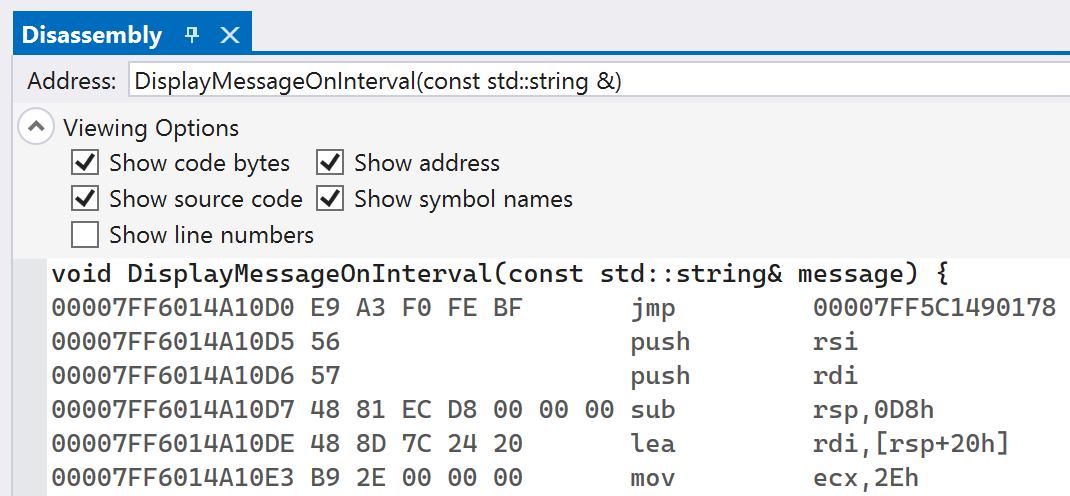
One interesting thing about the jump is that Detours uses a relative jump, instead of a jump to an absolute address as was demonstrated in the previous section. This is useful because it takes up less bytes: five bytes for the relative jump, while the absolute requires twelve bytes. The only downside is that the destination address must reside within a 2 GB range, either forward of backwards, in memory from the source instruction. In practical terms this limitation is usually not an issue.

You can also inspect the address of HookDisplayMessageOnIntervalTrampoline to see the trampoline that Detours generated. You can find the address by highlighting the variable while in a broken state. A context menu containing the address will pop up.

Getting the address of HookDisplayMessageOnIntervalTrampoline.

Putting this address in the Disassembly window will show the instructions at the trampoline. The original instruction that was overwritten by the five byte relative conditional jump was itself five bytes long, the trampoline will only contain one instruction, followed by an unconditional jump back to the original function.

The trampoline generated by Detours.

Function Hooking: Inline Hooks (1/7)

Filed under: Programming,Reverse Engineering — admin @ 11:39 PM

Table of Contents:

Function hooking is a technique that lets you intercept function calls and redirect them to another location. The true power of function hooking is the ability to take full control over the program’s runtime behavior. With function hooking, you define a hook function that carries out your desired logic; for example, adding functionality to log function calls, inspecting or overwriting function parameters, changing return values, or redefining functions in their entirety. After defining the hook function, you change the program to redirect control flow to it. There are many techniques to do this, which this series of posts will cover.

The best way to really understand function hooking is to try it out for yourself. Below is a demo program that will be used as the demonstration for the next several function hooking techniques.

// Disable warning for usage of ctime
#define _CRT_SECURE_NO_WARNINGS

#include <chrono>
#include <ctime>
#include <format>
#include <iostream>
#include <string>
#include <thread>

void DisplayMessageOnInterval(const std::string& message) {

    const auto currentTime{ std::chrono::system_clock::to_time_t(
        std::chrono::system_clock::now()) };

    std::cout << std::format("{} @ {}",
        message, std::ctime(&currentTime)) << std::endl;
}

int main(int argc, char* argv[]) {

    while (true) {
        DisplayMessageOnInterval("Hello World!");
        std::this_thread::sleep_for(std::chrono::seconds(5));
    }

    return 0;
}

The program is rather simple; there is a DisplayMessageOnInterval function that takes in a message to print out. This function gets called in a loop where it will print out the message and the current time, then execution will pause for five seconds before looping.

Inline Hooks

Inline hooks are a type of function hook that involve changing a program’s control flow by directly patching its instruction bytes. When a function gets called, instead of executing the expected prologue instructions, it will execute an unconditional jump that was patched in at runtime. This unconditional jump will redirect control flow over to a function that you have written – the hook function. From this hook function, you have full control: you can change the values of the arguments and call the original function, you can call the original function and modify the return value, or you can choose to not call the original function at all and execute something entirely different!

Inspecting the target function

To see the assembly instructions of the DisplayMessageOnInterval function, set a breakpoint on the function by highlighting the line with the function’s name and pressing F9 in Visual Studio. After setting the breakpoint, execute the program with the debugger attached by pressing F5. Your breakpoint should be hit almost immediately after the program begins execution. At this point, the debugger is in a broken state and you can view the assembly instructions. In Visual Studio, navigate to the Disassembly window (select Debug -> Windows -> Disassembly from the menu bar at the top). This will bring you to the disassembly listing, which will show a mapping of the source code to the runtime addresses and assembly instructions (see the Running the demo below section for screenshots). The instructions that are displayed in that window should be similar to the ones shown below, though with different runtime addresses.

Runtime AddressInstruction BytesInstruction
0x00007FF7FEF7A8A048 89 4C 24 08mov qword ptr [rsp+0x8], rcx 
0x00007FF7FEF7A8A555push rbp 
0x00007FF7FEF7A8A656push rsi 
0x00007FF7FEF7A8A757push rdi 
0x00007FF7FEF7A8A848 81 EC 10 02 00 00sub rsp, 0x210 
0x00007FF7FEF7A8AF48 8D 6C 24 20lea rbp, [rsp+0x20] 
The instruction bytes that are present in the prologue of the DisplayMessageOnInterval function.

In the Disassembly window, you can perform single stepping of the instructions by pressing F10 to Step Into and F11 to Step Over an instruction. From here you can observe the state of the program as the function executes, starting at the prologue, moving to the actual function logic, and wrapping up with the epilogue instructions.

Creating the jump stub

Installing an inline hook is just a matter of overwriting these instructions with an unconditional jump to your hook function. Setting the hook can be accomplished by writing in the instructions below at the start of the function, though the specific use of unconditional jumps is just one technique of many.

Instruction BytesInstruction
48 B8 CC CC CC CC CC CC CC CCmov rax, 0xCCCCCCCC 
FF E0jmp rax 
An unconditional jump to a placeholder address. This placeholder address will be replaced with the hook address and these bytes will overwrite the prologue instructions of the DisplayMessageOnInterval function.

Here the value address at 0xCCCCCCCC is a placeholder and will be overwritten with the runtime address of the hook function. You can define a function to generate these instructions and substitute in the desired address, as is shown below:

std::array<unsigned char, 12> CreateJumpBytes(const void* const destinationAddress) {

    std::array<unsigned char, 12> jumpBytes{ {
        /*mov rax, 0xCCCCCCCCCCCCCCCC*/
        0x48, 0xB8, 0xCC, 0xCC, 0xCC, 0xCC, 0xCC, 0xCC, 0xCC, 0xCC,

        /*jmp rax*/
        0xFF, 0xE0
    } };
    
    // Replace placeholder value with the actual hook address
    const auto address{ reinterpret_cast<size_t>(destinationAddress) };
    std::memcpy(&jumpBytes[2], &address, sizeof(void *));

    return jumpBytes;
}

The CreateJumpBytes function generates the unconditional jump stub and writes in the hook address over the placeholder address.

Installing the hook

After building this stub, you can write it in place of the original instructions. The code for doing this is shown below. One important thing to note is that the memory page protections of the target address must be changed to PAGE_EXECUTE_READWRITE to allow the new instructions to be written in. Failure to do so will result in an access violation at runtime.

void InstallInlineHook(void* const targetAddress, const void* const hookAddress) {

    const auto hookBytes{ CreateJumpBytes(hookAddress) };
    const auto oldProtections{ ChangeMemoryPermissions(
        targetAddress, hookBytes.size(), PAGE_EXECUTE_READWRITE) };
    std::memcpy(targetAddress, hookBytes.data(), hookBytes.size());
    ChangeMemoryPermissions(targetAddress, hookBytes.size(), oldProtections);

    FlushInstructionCache(GetCurrentProcess(), nullptr, 0);
}

The InstallInlineHook function overwrites the instructions at the target address with the generated unconditional jump stub.

At this point, all that is left is to write the hook function. To keep it simple, the hook function, defined as HookDisplayMessageOnInterval, does nothing more than print out a message to the console.

void HookDisplayMessageOnInterval(const std::string& message) {

    std::cout << "HookDisplayMessageOnInterval function called!"
        << std::endl;
}

The definition of the hook function that will be called.

After executing the InstallInlineHook function, with DisplayMessageOnInterval as the target address and HookDisplayMessageOnInterval as the hook address, the assembly instructions at the start of DisplayMessageOnInterval will look similar to those in the table below, although with different runtime addresses.

Runtime AddressInstruction BytesInstruction
0x00007FF6F0BEA8A048 B8 00 AA BE F0 F6 7F 00 00mov rax, 0x7FF7FEF7AA00 
0x00007FF6F0BEA8AAFF E0jmp rax 
0x00007FF6F0BEA8AC02 00add al, byte ptr [rax] 
0x00007FF6F0BEA8AE00 48 8Dadd byte ptr [rax-0x73], cl 
0x00007FF6F0BEA8B16Cins byte ptr [rdi], dx 
0x00007FF6F0BEA8B224 20and al, 0x20 
The prologue instructions of DisplayMessageOnInterval after the unconditional jump stub has been written.

Verifying the hook

Now when the program runs, the message should get printed out to the console from the hook function instead of the original. At this point, control flow of the original function has changed to the defined hook function, and as shown, any code that is present in the hook function will get executed. However, since the original instructions were overwritten, control cannot get passed back to the original function. To resolve this, the original instructions must be saved and relocated elsewhere in the program’s address space. This technique is called creating a trampoline function and is covered in the next post.

Running the demo

The InlineHook project provides the full implementation that was presented in this section. The best way to see what is happening is to set a breakpoint on the line that installs the hook, and the line immediately afterward as shown below.

Setting a breakpoint on InstallInlineHook and the next immediate line.

After setting the breakpoints, launch the executable in Visual Studio. The breakpoint should be hit immediately. Navigate to the Disassembly window and type in DisplayMessageOnInterval in the Address text box. After doing this, you should see the assembly instructions for the function.

The assembly instructions corresponding to DisplayMessageOnInterval.

Continue execution so that the next breakpoint gets hit. At this point, the hook has been installed and you can navigate back to the Disassembly window. When looking at DisplayMessageOnInterval in this window again, you should see different instructions that show the hook address being moved into the RAX register, followed by an unconditional jump to RAX.

The unconditional jump to the hook address is shown after the hook is installed.

Now the inline hook is in place and any call to DisplayMessageOnInterval will instead be re-routed to HookDisplayMessageOnInterval, as you can see for yourself by continuing execution of the program.

October 17, 2022

TED: The Tiny Exfiltrating Debugger

TED is a limited general purpose reverse engineering API, and hybrid debugger, that allows for inspection and modification of a program’s inner workings. TED carries out its functionality by being injected into a target process and starting a gRPC server, which clients can then connect to. There are a large set of services available to perform typical operations such as enumerating loaded modules, reading and writing memory, enabling and disabling breakpoints, disassembling address ranges, loading and unloading other modules, and more.

From a high level, TED works as follows:

A host application is responsible for loading the TED Client Bridge DLL, which has a set of APIs that handle client message building and server response parsing. After the Client Bridge DLL has been successfully loaded, the host application can use a helper API to inject the TED Core DLL into a target application. Assuming the DLL injection happened successfully, the Core DLL will launch a gRPC server listening on localhost:50051. The client can then invoke desired gRPC services and have them execute in the context of the target application. Service definitions are provided in a TED.proto file; they are either basic request-response, or a streaming service for receiving breakpoint events and their associated information.

After the client and server have both been loaded successfully, performing communication between the two is rather straightforward. The host application will create a client connection to the underlying server via a TED_CreateClient call. This will return an opaque handle to the caller that will then be passed to all subsequent APIs. Once the host application is done with the connection, it can call TED_DestroyClient to officially close the connection and clean up. This patterns follows for the rest of the APIs; all APIs that return a response have a corresponding TED_DestroyX API that will clean up allocated memory.

The code snippet below demonstrates injecting the TED Core DLL into another process, creating a client to establish communication, and receiving a response from the server that contains information about all loaded modules in the target process.

// Load client API and resolve functions
auto moduleHandle{ TED_LoadClientAPI("TEDClientAPI.dll") };
TED_ResolveClientFunctions(moduleHandle);

// Get process id of target
DWORD targetProcessId{};
GetWindowThreadProcessId(FindWindow(nullptr, L"Untitled - Notepad"), &targetProcessId);
	
// Get full path of TED Core DLL so that target process can load it
std::array<char, MAX_PATH> currentDirectoryPath{};
auto size{ GetModuleFileNameA(nullptr, currentDirectoryPath.data(), MAX_PATH) };
std::string coreDllPath{ currentDirectoryPath.data(), size };
coreDllPath = coreDllPath.substr(0, coreDllPath.find_last_of("\\")) + std::string{"\\TEDCore.dll"};

TED_InjectIntoProcess(targetProcessId, coreDllPath.c_str());

// Create the client
auto client{ TED_CreateClientFnc("localhost:50051") };
	
// Get the modules
auto response{ TED_GetModulesFnc(client) };

// Enumerate over the response
for (size_t i{ 0 }; i < response->moduleInfoCount; i++) {
	const auto* moduleInfo{ response->moduleInfo[i] };
	std::cout << std::format("Module name: {}\tModule base address: {:X}\tModule size: {:X}",
		moduleInfo->name,
		moduleInfo->baseAddress,
		moduleInfo->size)
	<< std::endl;

	for (size_t j{ 0 }; j < moduleInfo->executableSectionCount; j++) {
		const auto* executableSection{ response->moduleInfo[i]->executableSections[j] };
		std::cout << std::format("Section: {}\tSection base address: {:X}\tSection size: {:X}",
			executableSection->name,
			executableSection->address,
			executableSection->size)
		<< std::endl;
	}
}

// Clean up modules response
TED_DestroyModulesFnc(response);

// Clean up client
TED_DestroyClientFnc(client);

Running this code while having Notepad open will produce the following output:

Module name: C:\Program Files\WindowsApps\Microsoft.WindowsNotepad_11.2208.25.0_x64__8wekyb3d8bbwe\Notepad\Notepad.exe Module base address: 7FF60B660000        Module size: 84000
Section: .text  Section base address: 7FF60B661000      Section size: 49C00
Module name: C:\WINDOWS\SYSTEM32\ntdll.dll      Module base address: 7FFF70250000       Module size: 214000
Section: .text  Section base address: 7FFF70251000      Section size: 12D000
Section: PAGE   Section base address: 7FFF7037E000      Section size: 1000
Section: RT     Section base address: 7FFF7037F000      Section size: 1000
Section: fothk  Section base address: 7FFF70380000      Section size: 1000
Module name: C:\WINDOWS\System32\KERNEL32.DLL   Module base address: 7FFF6EC80000       Module size: C2000
Section: .text  Section base address: 7FFF6EC81000      Section size: 80000
Module name: C:\WINDOWS\System32\KERNELBASE.dll Module base address: 7FFF6DCB0000       Module size: 39C000
Section: .text  Section base address: 7FFF6DCB1000      Section size: 189000

...

As a quick aside to the above code snippet, the memory management can be made more simple. Since the client APIs are exported with C linkage, there need to be corresponding cleanup functions for memory that gets allocated during a request-response flow. However, in a host application, these can be wrapped with smart pointers to ensure that no memory will get leaked. Below is an example of this, and is the preferred way to develop against the library:

// Create the client
std::unique_ptr<TED_Client, TED_DestroyClientFncPtr> client{
	TED_CreateClientFnc("localhost:50051"),
	TED_DestroyClientFnc };
	
// Get the modules
std::unique_ptr<TED_GetModulesResponse, TED_DestroyModulesFncPtr> response{
	TED_GetModulesFnc(client.get()),
	TED_DestroyModules };

// "client and "response" memory will be freed when they go out of scope

The next example shows how to set a breakpoint and subscribe for a streaming response from the server. This will set a breakpoint on a commonly used function in UI applications: DispatchMessage. When this function is executed, the server will capture information about the program’s state, and send it to the client. The client then prints out the results to the console. Since the service returns a streaming response, the client continues to listen to the stream and prints out messages as they come in. On the server, there is a persistent connection established and breakpoint information events are sent to the clients as they are received.

// Load client API and resolve functions
auto moduleHandle{ TED_LoadClientAPI("TEDClientAPI.dll") };
TED_ResolveClientFunctions(moduleHandle);

// Get process id of target
DWORD targetProcessId{};
GetWindowThreadProcessId(FindWindow(nullptr, L"Untitled - Notepad"), &targetProcessId);

// Get full path of TED Core DLL so that target process can load it
std::array<char, MAX_PATH> currentDirectoryPath{};
auto size{ GetModuleFileNameA(nullptr, currentDirectoryPath.data(), MAX_PATH) };
std::string coreDllPath{ currentDirectoryPath.data(), size };
coreDllPath = coreDllPath.substr(0, coreDllPath.find_last_of("\\")) + std::string{ "\\TEDCore.dll" };

TED_InjectIntoProcess(targetProcessId, coreDllPath.c_str());

// Create the client
std::unique_ptr<TED_Client, TED_DestroyClientFncPtr> client{
	TED_CreateClientFnc("localhost:50051"),
	TED_DestroyClientFnc };

// Create the reader
std::unique_ptr<TED_BreakpointReader, TED_DestroyBreakpointReaderFncPtr> reader{
	TED_CreateBreakpointReaderFnc(client.get()),
	TED_DestroyBreakpointReaderFnc };

// Set a breakpoint on a DispatchMessageW
std::unique_ptr<TED_GenericResponse, TED_DestroyGenericFncPtr> breakpoint{
	TED_EnableBreakCallByAddressFnc(client.get(), (uint64_t)DispatchMessageW),
	TED_DestroyGenericFnc };

while (true) {
	std::unique_ptr<TED_BreakpointResponse, TED_DestroyBreakpointFncPtr> response{
		TED_GetBreakpointFnc(client.get(), reader.get()),
		TED_DestroyBreakpointFnc };
	if (response != nullptr) {

		std::cout << "Read breakpoint event\t"
			<< std::format("Process ID: {}\tThread ID: {}\tSource Address: {:X}\tDestination Address: {:X}",
				response->processId, response->threadId, response->sourceAddress, response->destinationAddress)
			<< std::endl;

		std::cout << "Context: \n";
			// Output context information here (see proto definition)

		std::cout << "Call stack: \n";
		if (response->callStack.stackFramesCount > 0) {
			for (size_t i{ 0 }; i < response->callStack.stackFramesCount; i++) {
				const auto* stackFrame = response->callStack.stackFrames[i];
				std::cout
					<< std::format("RIP:{:X} Return Address:{:X} Frame Pointer:{:X} Stack Pointer:{:X}",
						stackFrame->rip,
						stackFrame->returnAddress,
						stackFrame->framePointer,
						stackFrame->stackPointer)
					<< std::format(" Param 1:{:X} Param 2:{:X} Param 3:{:X} Param 4:{:X}",
						stackFrame->parameters[0],
						stackFrame->parameters[1],
						stackFrame->parameters[2],
						stackFrame->parameters[3]);
				if (stackFrame->symbols.functionNameLength > 0) {
					std::cout << " " << stackFrame->symbols.functionName;
				}

				std::cout << std::endl;
			}
		}
	}
}

Running the above code will produce the following output:

Read breakpoint event   Process ID: 78648       Thread ID: 73480        Source Address: 7FFF6EE17A20    Destination Address: 7FFF6EE17A22
Context:
Call stack:
Read breakpoint event   Process ID: 78648       Thread ID: 73480        Source Address: 7FFF6EE17A20    Destination Address: 7FFF6EE17A22
Context:
Call stack:
Read breakpoint event   Process ID: 78648       Thread ID: 73480        Source Address: 7FFF6EE17A20    Destination Address: 7FFF6EE17A22
Context:
Call stack:

The output should flood the screen as you scroll through the Notepad UI since DispatchMessage will be constantly invoked. As the output seems to hint at, it is possible to get context and call stack information back to the caller. This can be done by setting the appropriate options to have the Core DLL return this information back to the client.

// Set options
TED_Options breakpointOptions{};
breakpointOptions.returnCallStack = true;
breakpointOptions.returnContext = true;
breakpointOptions.returnSymbolInfo = true;

std::unique_ptr<TED_GenericResponse, TED_DestroyGenericFncPtr> options{
	TED_SetOptionsFnc(client.get(), &breakpointOptions),
	TED_DestroyGenericFnc };

After setting these options and re-running, the output contains call stack and symbol information:

Read breakpoint event   Process ID: 59016       Thread ID: 16644        Source Address: 7FFF6EE17A20    Destination Address: 7FFF6EE17A22
Context:
Call stack:
RIP:7FFF6EE17A22 Return Address:7FF60B6794D5 Frame Pointer:0 Stack Pointer:12748FFC68 Param 1:15D25B5 Param 2:15D25B5 Param 3:12748FFCD9 Param 4:0 DispatchMessageW
RIP:7FF60B6794D5 Return Address:7FF60B6A5DBA Frame Pointer:0 Stack Pointer:12748FFC70 Param 1:1 Param 2:1 Param 3:0 Param 4:0
RIP:7FF60B6A5DBA Return Address:7FFF6EC9244D Frame Pointer:0 Stack Pointer:12748FFD40 Param 1:0 Param 2:0 Param 3:0 Param 4:0
RIP:7FFF6EC9244D Return Address:7FFF702ADF78 Frame Pointer:0 Stack Pointer:12748FFD80 Param 1:0 Param 2:0 Param 3:0 Param 4:0 BaseThreadInitThunk
RIP:7FFF702ADF78 Return Address:0 Frame Pointer:0 Stack Pointer:12748FFDB0 Param 1:0 Param 2:0 Param 3:0 Param 4:0 RtlUserThreadStart

To show some of the power of the TED API, I have developed a client application that will log all CALL instructions that a target application executes. I then used this application against Portal 2, attaching to client.dll, with the goal of finding the code that is executed when a player shoots their portal gun.

To do this, I first set the Call Logger application to automatically disable incoming breakpoints (Options -> Auto disable incoming from the menu). This allows you to filter out irrelevant events – and there will be plenty – when searching. After clearing the breakpoints window (Filter -> Clear from the menu), running around in-game, clearing again, going back to the game and running around again, I got to a point where most of the irrelevant breakpoints were automatically disabled and the breakpoints window was not being flooded with new rows.

At this point, I turned off the auto disable functionality, and began shooting the portal gun in the game. In the breakpoints window, I tracked the hit counts of source addresses and found those that incremented by one when I shot the portal gun. Right clicking a row and selecting “Copy addresses” from the context menu gave me the appropriate address information:

Source: 0x2ba8c0dc (client.dll+0x59c0dc) 	 Destination: 0x2bac93b0 (client.dll+0x5d93b0)

The next step is to restart Portal 2, attach x64dbg to it, and navigate to client.dll+0x59c0dc. Doing so gets you to the following place:

2E22C0C7 | 8B4D 18                  | mov ecx,dword ptr ss:[ebp+18]           |
2E22C0CA | 8B55 14                  | mov edx,dword ptr ss:[ebp+14]           |
2E22C0CD | 8B06                     | mov eax,dword ptr ds:[esi]              |
2E22C0CF | 51                       | push ecx                                |
2E22C0D0 | 8B4D 08                  | mov ecx,dword ptr ss:[ebp+8]            |
2E22C0D3 | 52                       | push edx                                |
2E22C0D4 | 8B50 74                  | mov edx,dword ptr ds:[eax+74]           |
2E22C0D7 | 53                       | push ebx                                |
2E22C0D8 | 57                       | push edi                                |
2E22C0D9 | 51                       | push ecx                                |
2E22C0DA | 8BCE                     | mov ecx,esi                             |
2E22C0DC | FFD2                     | call edx                                |
2E22C0DE | 5F                       | pop edi                                 |
2E22C0DF | 5E                       | pop esi                                 |
2E22C0E0 | 5B                       | pop ebx                                 |
2E22C0E1 | 5D                       | pop ebp                                 |
2E22C0E2 | C2 1400                  | ret 14                                  |

The call instruction at 0x2E22C0DC is the one that was triggered when the portal gun was fired. It naturally makes sense to set a breakpoint in x64dbg on this address. Doing so and navigating back to the game shows no effects. However, when the portal gun is fired, the breakpoint gets triggered, which lines up with what the Call Logger showed. When the breakpoint is hit, the following program state is present.

These registers don’t make much immediate sense, but EDI and EBX look interesting as they are the second and third arguments to the function and have integer values. Clicking to shoot several times shows that these values stay consistent. However, there is a change when you choose to shoot a blue portal versus an orange one (left click versus right click). Clicking the right mouse button to shoot gives the following values when the breakpoint gets hit:

The value in EBX has changed from 3 to 2, and the value in EDI has changed from 0x1C to 0xF8.

Looking up above, EBX and EDI are derived from what gets stored in EAX, which gets passed into the function that we’re looking at.

287EC0B8 | 8B45 10                  | mov eax,dword ptr ss:[ebp+10]           |
287EC0BB | 03C0                     | add eax,eax                             |
287EC0BD | 03C0                     | add eax,eax                             |
287EC0BF | 2BD8                     | sub ebx,eax                             |
287EC0C1 | 03F8                     | add edi,eax                             |
287EC0C3 | 85DB                     | test ebx,ebx                            |
287EC0C5 | 74 17                    | je client.287EC0DE                      |

But before getting side tracked further reverse engineering, the functionality of the Call Logger does seem to have been validated, and within around 5 minutes of playing around with it, the location of code responsible for handling a weapon fire event has been found. This is a rather quick discovery; the alternative usually being to set breakpoints on Windows APIs related to key presses and tracing from there to find the relevant application code.

The source code for the TED API, Call Logger, and other demo applications is available on GitHub. Visual Studio is used as the build IDE for the TED API and demo applications; the solution can opened in Visual Studio and 32 or 64-bit binaries can be built. As a prerequisite to building, a few external packages will need to be installed. The preferred way to do this is via vcpkg, and steps are shown to install the dependencies below:

git clone https://github.com/microsoft/vcpkg
.\vcpkg\bootstrap-vcpkg.bat

.\vcpkg install concurrentqueue:x64-windows-static
.\vcpkg install capstone:x64-windows-static
.\vcpkg install capstone[x86]:x64-windows-static
.\vcpkg install grpc:x64-windows-static

.\vcpkg install concurrentqueue:x86-windows-static
.\vcpkg install capstone:x86-windows-static
.\vcpkg install capstone[x86]:x86-windows-static
.\vcpkg install grpc:x86-windows-static

.\vcpkg integrate install

The Call Logger application is built with Qt 6 and can be loaded in Qt Creator (preferred), or built with CMake. A release version of the Call Logger for 32 and 64-bit applications can be found on the releases page of the TED GitHub repository.

August 1, 2022

Creating an ESP: Conclusion (4/4)

Filed under: Game Hacking,Programming,Reverse Engineering — admin @ 8:43 PM

Table of Contents:

That wraps it up for how to create an extra-sensory perception (ESP) hack. Two important concepts were introduced in this series: the world-to-screen transformation, and hooking the underlying graphics API in order to draw information on the game’s screen. Both of these concepts are applicable outside of just developing ESP hacks. World-to-screen, although common in ESPs, can also be used in making bots for when you want your character to react to what is on the screen, i.e. moving towards, or away, from an enemy. Hooking the graphics API has tons of applications, including legitimate ones like drawing third-party overlays on the game’s screen.

The availability of the Source SDK code was a great help throughout both this series and in the creating an aimbot one. By having the source available, we were able to more easily reverse engineer the relevant interfaces and obtain pointers to them at runtime, and we were also able to lift the code responsible for performing the world-to-screen transformation.

The full source code for the ESP hack that was developed throughout this series is available on GitHub.

Creating an ESP: Drawing (3/4)

Filed under: Game Hacking,Programming,Reverse Engineering — admin @ 8:42 PM

Table of Contents:

Now that we are at a point where we can get screen coordinates for an entity, the drawing part should be simple. We will start off with a very basic approach: drawing externally. This will be done by calling the DrawText function in GDI. We can create a function to achieve this as follows:

void DrawTextGDI(const Vector2& screenPosition, const std::string text) {

    auto windowHandle = FindWindow(L"Valve001", L"HALF-LIFE 2 - Direct3D 9");
    auto windowDC = GetDC(windowHandle);

    SetBkColor(windowDC, RGB(0, 0, 0));
    SetBkMode(windowDC, TRANSPARENT);
    SetTextColor(windowDC, RGB(0xFF, 0xA5, 0x00));

    RECT rect{};
    DrawTextA(windowDC, text.c_str(), text.length(), &rect, DT_CALCRECT);
    auto size{ rect.right -= rect.left };
    rect.left = static_cast<LONG>(screenPosition.x - size / 2.0f);
    rect.right = static_cast<LONG>(screenPosition.x + size / 2.0f);
    rect.top = static_cast<LONG>(screenPosition.y - 20);
    rect.bottom = rect.top + size;

    DrawTextA(windowDC, text.c_str(), -1, &rect, DT_NOCLIP);
}

Here we find the game window, get the device context, and draw the text. We can write a function to loop through the entity list and draw the text above enemy entities.

void DrawEnemyEntityText() {

    auto* serverEntity{ reinterpret_cast<IServerEntity*>(
    GetServerTools()->FirstEntity()) };

    if (serverEntity != nullptr) {
        do {
            auto* modelName{ serverEntity->GetModelName().ToCStr() };
            if (modelName != nullptr) {
                auto entityName{ std::string{GetEntityName(serverEntity)} };

                if (IsEntityEnemy(entityName)) {

                    auto enemyEyePosition{ GetEyePosition(serverEntity) };
                    Vector2 screenPosition{};
                    auto shouldDraw{ WorldToScreen(enemyEyePosition, screenPosition) };

                    if (shouldDraw) {
                        DrawTextGDI(screenPosition, entityName);
                    }
                }
            }

            serverEntity = reinterpret_cast<IServerEntity*>(
                GetServerTools()->NextEntity(serverEntity));

        } while (serverEntity != nullptr);
    }
}

Calling this function in a loop and looking at the results, we see the following

The results look pretty good. However, if your refresh rate is high enough, there will be a very noticeable flicker in the text. What is happening is that the game’s rendering is conflicting with our drawing; we are trying to constantly draw something on the screen (our text) and the game engine is also trying to constantly draw something on the screen (the player’s view). There are a couple of ways to get around this: you can use SetWindowLongPtr to subclass the window and install a new window procedure. This will allow you to handle WM_PAINT messages and draw your text. Or you can create an entirely new window to draw on and keep it activated at the foreground, though this approach has problems with games running in full screen mode.

Ideally we would want to render our text the same way that the game renders its graphics. This is possible, but it will require additional work. To have the game render our text, we will need to hook in to the function that gets executed after rendering. In Direct3D9 games this is the EndScene function, and will be our target. Fortunately, finding this function is pretty easy. Since Microsoft ships symbols for d3d9.dll, we can attach a debugger, load the symbols, and get the address.

From here we can create a function pointer to it as we did earlier for the interfaces

DWORD_PTR GetEndSceneAddress() {

    constexpr auto globalEndSceneOffset = 0x5C0B0;
    auto endSceneAddress{ reinterpret_cast<DWORD_PTR>(
    GetModuleHandle(L"d3d9.dll")) + globalEndSceneOffset };

    return endSceneAddress;
}

Now that the function address is known, we can install a hook on it. To do this, I will be reusing the HookEngine class from an earlier article series. The hook logic will be pretty simple: we will call the DrawEntityEnemyText function as before and then call the original EndScene function.

HRESULT WINAPI EndSceneHook(IDirect3DDevice9* device) {

    DrawEnemyEntityText(device);

    using EndSceneFnc = HRESULT(WINAPI*)(IDirect3DDevice9* device);
    auto original{ (EndSceneFnc)HookEngine::GetOriginalAddressFromHook(EndSceneHook) };
    HRESULT result{};
    if (original != nullptr) {
        result = original(device);
    }

    return result;
}

In DrawEnemyEntityText, instead of calling DrawTextGDI, we will write a new function, DrawTextD3D9, which will draw text using Direct3D APIs.

ID3DXFont* GetFont(IDirect3DDevice9* device) {

    static ID3DXFont* font{};

    if (font != nullptr) {
        return font;
    }

    if (device == nullptr) {
        std::cerr << "No device to create font for."
            << std::endl;
        return nullptr;
    }

    D3DXFONT_DESC fontDesc {
        .Height = 30,
        .Width = 0,
        .Weight = FW_REGULAR,
        .MipLevels = 0,
        .Italic = false,
        .CharSet = DEFAULT_CHARSET,
        .OutputPrecision = OUT_DEFAULT_PRECIS,
        .Quality = DEFAULT_QUALITY,
        .PitchAndFamily = DEFAULT_PITCH | FF_DONTCARE,
        .FaceName = L"Consolas"
    };

    auto result{ D3DXCreateFontIndirect(device, &fontDesc, &font) };
    if (FAILED(result))
    {
        std::cerr << "Could not create font. Error = "
            << std::hex << result
            << std::endl;
    }

    return font;
}

void DrawTextD3D9(const Vector2& screenPosition, const std::string text, IDirect3DDevice9* device) {

    RECT rect{};
    GetFont(device)->DrawTextA(nullptr, text.c_str(), text.length(), &rect, DT_CALCRECT, D3DCOLOR_XRGB(0, 0, 0));
    int size{ rect.right -= rect.left };
    rect.left = static_cast<LONG>(screenPosition.x - size / 2.0f);
    rect.right = static_cast<LONG>(screenPosition.x + size / 2.0f);
    rect.top = static_cast<LONG>(screenPosition.y - 20);
    rect.bottom = rect.top + size;
    GetFont(device)->DrawTextA(nullptr, text.c_str(), -1, &rect, DT_NOCLIP, D3DCOLOR_XRGB(0xFF, 0xA5, 0x00));
}

The DrawTextD3D9 function looks very close to DrawTextGDI, but it performs its drawing on the game’s IDirect3DDevice9 device instead of directly on top of the window. As a result, we are rendering our text in the same rendering pipeline, and the text flicker will not be present. You can see the before and after below.

We now have a functional proof of concept that performs world-to-screen transformation of entities and displays text above their heads. The steps shown throughout this series are common to all ESP hacks and can be used as a reference in building more complex ones.

« Newer PostsOlder Posts »

Powered by WordPress